For one of my hacks for the EDINA ran Will’s World Hack day/week, I’ve decided to compile an infographic/visualisation using the search results from a number of search engines.
The data was compiled in a few ways:
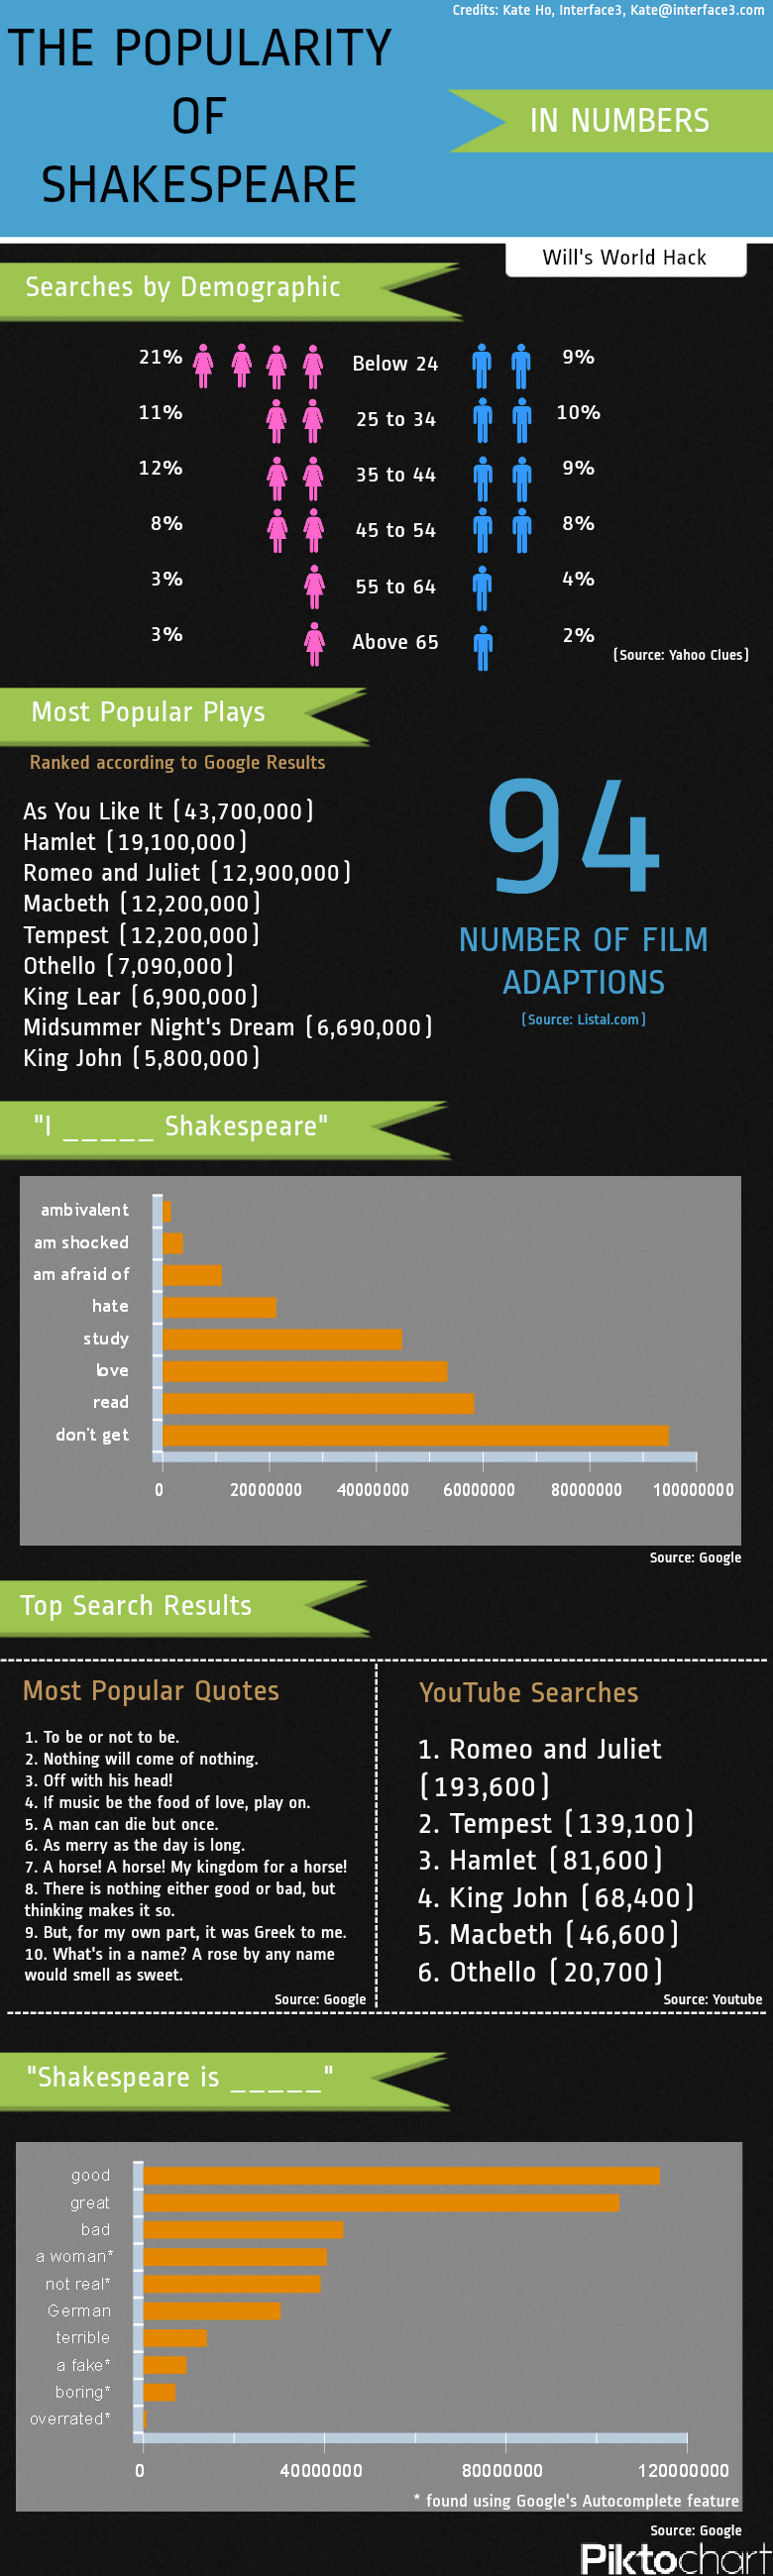
- The demographic data came from Yahoo Clues using the search term ‘shakespeare’
- The film adaptations number came from Listal.com using the phrase ‘shakespeare adaptations’
- The popular plays data was acquired through a php script co-written by myself and a colleague (Chris Reilly). It cycled through all the play’s names and grabbed the number of overall results from Google
- The phrase completion data was a combination of playing with Google Autocomplete and Google search results
The hack itself took just under 5 hours. At least 1 of those hours was trying to work out what infographic package to use (I’ve never used any before) and understanding what makes an interesting infographic.

One thought on “Popularity of Shakespeare in Numbers (Infographic)”